


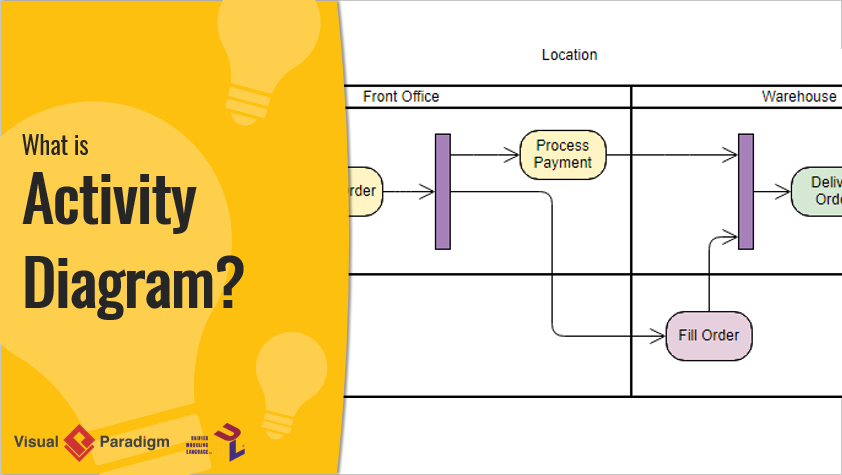
Introduction
In the realm of software development and system modeling, UML (Unified Modeling Language) activity diagrams play a crucial role in visualizing the workflow of processes within a system. These diagrams provide a clear and structured way to represent the sequence of activities, decisions, and interactions involved in achieving specific goals. UML (Unified Modeling Language) activity diagrams are a powerful tool for modeling the workflow of a system, illustrating the sequence of activities, decisions, and processes involved in achieving a specific goal. This guide will cover the key concepts of UML activity diagrams, provide examples, and recommend Visual Paradigm as an ideal tool for IT software development.
This article delves into the intricacies of UML activity diagrams, using a detailed example to illustrate the lifecycle of an assignment, from issuance to grading and return, involving both a teacher and a student. By breaking down the key components and workflow of the diagram, we aim to provide a comprehensive understanding of how UML activity diagrams can be used to model complex processes effectively. Whether you are a seasoned developer or new to UML, this guide will help you grasp the fundamentals and advanced concepts of activity diagrams, enabling you to apply them to your own projects with confidence.
Key Concepts of UML Activity Diagrams
-
Activities:
- Represent actions or tasks performed within the system.
- Depicted as rounded rectangles.
-
Actions:
- The most basic unit of work in an activity diagram.
- Represented as rectangles with rounded corners.
-
Control Flow:
- Shows the sequence in which activities are performed.
- Represented by solid arrows connecting activities.
-
Decision Nodes:
- Represent points where the flow of control can branch based on conditions.
- Depicted as diamonds.
-
Fork and Join Nodes:
- Fork nodes split a single flow into multiple concurrent flows.
- Join nodes merge multiple flows back into a single flow.
- Both are depicted as horizontal bars.
-
Initial and Final Nodes:
- Initial node represents the start of the workflow.
- Final node represents the end of the workflow.
- Both are depicted as black circles, with the initial node having an outgoing arrow and the final node having an incoming arrow.
-
Object Flow:
- Shows the flow of objects between activities.
- Represented by dashed arrows.
Examples of UML Activity Diagrams
The activity diagram models the problem of managing the lifecycle of an assignment, from issuance to grading and return, involving interactions between a teacher and a student. The key aspects of the problem include:
-
Assignment Issuance and Study:
- The teacher issues an assignment, and the student studies it.
- The student’s perception of the assignment’s difficulty influences their approach to completing it.
-
Assignment Completion and Submission:
- The student completes the assignment and submits it to the teacher.
- The student may decide to give up on the assignment based on certain conditions.
-
Deadline Management:
- The teacher sets a deadline for the assignment submission.
- The workflow accounts for the deadline and proceeds accordingly.
-
Grading and Return:
- The teacher grades the submitted assignment and stores the grades.
- The graded assignment is returned to the student.
-
Concurrent Activities:
- The diagram models concurrent activities, such as grading the assignment and storing the grades, using fork and join nodes.
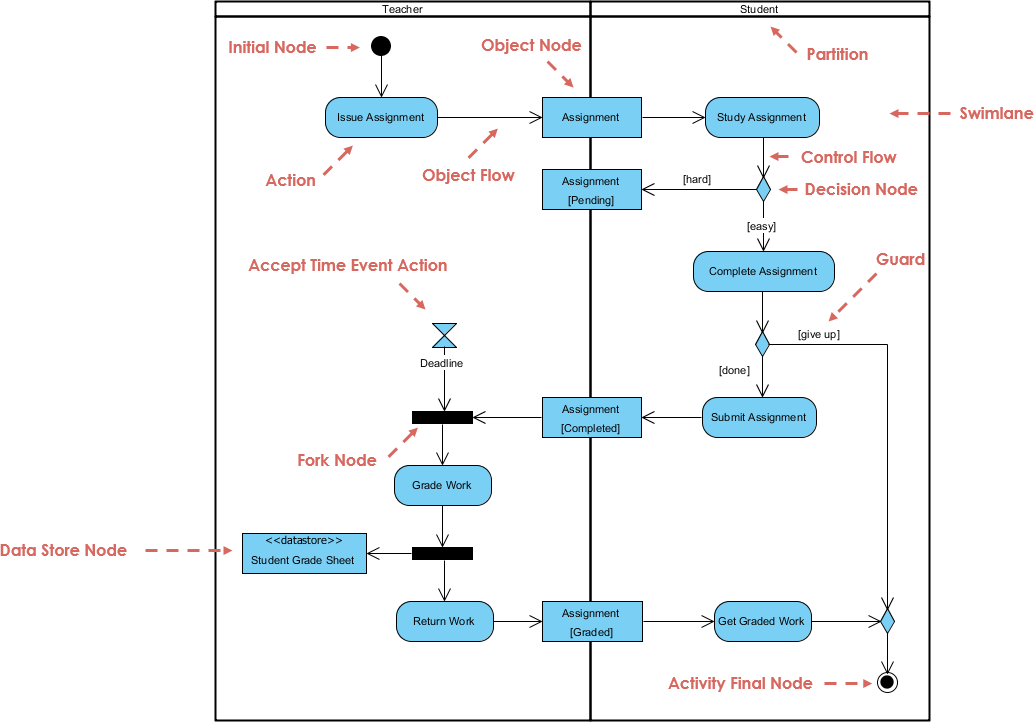
Key Components and Workflow
-
Initial Node:
- The process begins with the Initial Node, represented by a black circle. This indicates the start of the workflow.
-
Issue Assignment (Teacher):
- The teacher issues the assignment, represented by the action “Issue Assignment”.
- An Object Node (Assignment) is created, indicating that an assignment object is generated.
-
Assignment (Object Flow):
- The assignment object flows from the teacher to the student, represented by the Object Flow arrow.
-
Study Assignment (Student):
- The student receives the assignment and begins studying it, represented by the action “Study Assignment”.
- This action is within the Student swimlane, indicating that it is the student’s responsibility.
-
Decision Node (Control Flow):
- The student decides whether the assignment is hard or easy, represented by the Decision Node (diamond shape).
- Depending on the decision, the control flow branches into two paths:
- [hard]: If the assignment is hard, the student continues to study.
- [easy]: If the assignment is easy, the student proceeds to complete the assignment.
-
Complete Assignment (Student):
- The student completes the assignment, represented by the action “Complete Assignment”.
- A Guard condition [give up] determines whether the student submits the assignment or gives up.
-
Submit Assignment (Student):
- If the student completes the assignment, they submit it, represented by the action “Submit Assignment”.
- The assignment object flows back to the teacher, represented by the Object Flow arrow.
-
Accept Time Event Action (Teacher):
- The teacher sets a deadline for the assignment, represented by the Accept Time Event Action (hourglass symbol).
- If the deadline is reached, the workflow proceeds to the Fork Node.
-
Fork Node:
- The Fork Node (thick horizontal bar) splits the workflow into two concurrent paths:
- Grade Work (Teacher): The teacher grades the submitted assignment, represented by the action “Grade Work”.
- Data Store Node: The graded assignment is stored in a datastore, represented by the Data Store Node (<<datastore>> Student Grade Sheet).
- The Fork Node (thick horizontal bar) splits the workflow into two concurrent paths:
-
Return Work (Teacher):
- The teacher returns the graded work to the student, represented by the action “Return Work”.
- The assignment object flows back to the student, represented by the Object Flow arrow.
-
Get Graded Work (Student):
- The student receives the graded work, represented by the action “Get Graded Work”.
-
Activity Final Node:
- The process ends with the Activity Final Node, represented by a black circle with a border, indicating the completion of the workflow.
This UML activity diagram effectively models the workflow of managing an assignment, highlighting the interactions between the teacher and the student, the decision points, and the concurrent activities involved. It provides a clear visual representation of the assignment lifecycle, from issuance to grading and return, making it easier to understand and manage the process.
Recommending Visual Paradigm for IT Software Development
While the examples above illustrate the basics of UML activity diagrams, Visual Paradigm offers a more comprehensive and visual approach to software development. Here’s why Visual Paradigm is an ideal tool for IT software development:
-
Comprehensive UML Support:
- Visual Paradigm supports all types of UML diagrams, including activity diagrams, class diagrams, sequence diagrams, and more.
- It provides a rich set of tools and features for creating, editing, and managing UML diagrams.
-
User-Friendly Interface:
- The intuitive drag-and-drop interface makes it easy to create and modify UML diagrams.
- The tool offers a wide range of customization options to tailor diagrams to specific needs.
-
Integration with Other Tools:
- Visual Paradigm integrates seamlessly with other development tools, such as IDEs, version control systems, and project management tools.
- This integration ensures a smooth workflow and enhances productivity.
-
Collaboration Features:
- Visual Paradigm supports collaborative work, allowing multiple users to work on the same project simultaneously.
- The tool includes features for version control, team collaboration, and real-time updates.
-
Advanced Modeling Capabilities:
- Visual Paradigm offers advanced modeling capabilities, including support for agile methodologies, enterprise architecture, and system modeling.
- The tool provides a comprehensive suite of features for modeling complex systems and workflows.
-
Extensive Documentation and Support:
- Visual Paradigm provides extensive documentation, tutorials, and support resources to help users get started and master the tool.
- The tool offers a range of learning resources, including video tutorials, guides, and examples.
Conclusion
UML activity diagrams are a powerful tool for modeling the workflow of a system, illustrating the sequence of activities, decisions, and processes involved in achieving a specific goal. The examples provided demonstrate the basics of creating UML activity diagrams. However, for a more comprehensive and visual approach to software development, Visual Paradigm is an ideal tool. With its comprehensive UML support, user-friendly interface, integration with other tools, collaboration features, advanced modeling capabilities, and extensive documentation and support, Visual Paradigm provides everything needed to create, manage, and collaborate on UML diagrams effectively. Whether you are a beginner or an experienced developer, Visual Paradigm offers the tools and support needed to bring your software development projects to life.